
Fusion Capital: Broader Than Venture
31 August 2026
Equity has scaled for development, but capital for deployment has yet to arrive

Fusion energy startups have seen a surge in investment from 2020 to 2026, accompanied by a notable broadening of who is writing the checks. According to FusionX data, the fusion industry attracted under $2 billion in total capital in the period to end-2020, that figure grew to $21.3 billion¹ of committed capital by end-July 2026. Even in tighter economic years, when broader venture markets softened, fusion funding remained comparatively resilient, reflecting sustained investor interest in the sector’s long-term potential.
While fusion is commonly perceived as a venture capital story, the allocation data tells a different one: strategic and institutional capital (corporates, family offices, government and public funds, and institutional investors) accounts for over 40% of allocated equity financing at every stage within the Dataset 2 sample. Venture capital anchors the sector, but it has never financed it alone. What remains absent to date is the capital that builds power plants: project finance, infrastructure equity, and debt.
Early fusion funding is characterised by a highly dispersed investor base, shaped by geography, institutional ties, and founder relationships, with signs of convergence in financing composition emerging in later rounds. Geographically, investment remains concentrated in North America and Europe, but capital is increasingly global as fusion hubs emerge in the U.S. (West Coast, Northeast), the U.K., and Europe (Germany, France).
By mid-2026, fusion fundraising has moved beyond its early, fragmented origins into a more mature ecosystem, marked by larger capital commitments, a more structured investor base, and rising public-sector engagement.
Dataset Overview
This analysis draws on two complementary FusionX datasets, each serving a distinct analytical purpose.
The first dataset (“Dataset 1”) is a round-level database covering the 15 leading private fusion developers² that have raised the majority of capital in the sector to date. It captures key characteristics of each funding round, including total capital raised (both equity in committed capital and notable non-dilutive financing) and timing. Given that several of these companies have funding histories extending back more than a decade, Dataset 1 provides a robust, though directional, view of how round sizes and funding cadence evolve across stages.
The second dataset (“Dataset 2”) is an updated FusionX extract that includes investor-level funding allocation. It is derived from the broader FusionX database of approximately 64 companies and $21.3 billion of committed capital by end-July 2026, but covers a subset of companies for which detailed investor allocation data is available. Stage-level figures should therefore be read as indicative of financing patterns within the sample. For each round, specific investment amounts in committed capital are assigned to participating investors, enabling investor participation to be analysed by the share of allocated capital within each company’s financing mix.
Because the coverage of the two datasets is not identical, they are used in a complementary manner. Dataset 1 underpins the analysis of funding dynamics over time, while Dataset 2 is used for investor profile analysis.
Investment Dynamics
Capital Over Time
Total capital investment in fusion energy startups has accelerated sharply over the past decade, with a clear inflection point after 2020. By end-July 2026, cumulative funding reached approximately $21.3 billion of committed capital, reflecting a rapid scaling of capital commitments into the sector. This acceleration was not linear: after gradual growth through 2019, the market experienced a step-change beginning in 2021, followed by continued expansion supported by increasingly large later-stage rounds.
Annual investment patterns broadly mirror the global venture cycle with a surge in 2021, moderation in 2023, and renewed momentum thereafter. However, fusion stands out in the strength of its recovery. While broader venture markets remain below their 2021 peak, fusion funding has continued to expand, driven by a combination of mega-rounds and growing participation from strategic investors that often act through venture capital arms.
This surge in capital is largely driven by a shift toward later-stage financing. Prior to 2020, most fusion rounds were relatively small, typically below ~$10 million, with a few notable exceptions such as TAE Technologies. In contrast, the 2020s have seen multiple rounds exceeding $400 million, including financings by Commonwealth Fusion Systems, Helion Energy, Inertia, Pacific Fusion and Proxima Fusion. These outsized raises reflect increases in technological maturity, the inherently capital-intensive nature of scaling fusion systems and a growing willingness among investors to fund longer development cycles.
This shift toward later-stage financing underscores a structural transition: fusion is moving from financing research and early technology development to an industrial-scale investment cycle, where larger pools of capital are required to support demonstration and commercialisation milestones. As companies progress from sub-system development toward system integration, demonstration facilities, and first-of-a-kind plants, the scale and duration of required capital will steepen markedly. To date, growing needs have been met through larger and broader-based equity rounds, alongside public support. Beyond this, however, there is no clearly defined pathway for financing at scale. Fusion projects do not yet support the separation of development, construction, and operating risks that underpins conventional infrastructure capital structures, and it remains uncertain how such a transition will occur.
By Series – Round Sizes and Pace
Within Dataset 1, the median company takes roughly two years to move from Seed to Series A, and a similar two years from Series A to Series B. The longest transition comes later: reaching Series C takes a median of over three years – consistent with this being the stage where companies must convert laboratory-scale results into the engineering credibility that justifies substantially larger commitments.

At the same time, round sizes increase substantially at each stage, with the largest jumps concentrated early on. Within this dataset, the median Series A round is roughly 11× larger than the preceding Seed round, Series B rounds are around 4× the size of Series A, and by Series C the step-up moderates to roughly 1.4× even as absolute round sizes continue to grow.
Behind these numbers is a progression in what each stage actually funds. At Seed, companies are largely paper-stage: validating the concept through scientific publications and engineering design work, with no hardware built yet. The jump to Series A funds the first hardware – building and validating the core physics or engineering concept. Commonwealth Fusion Systems is the clearest example: its early rounds financed the HTS magnet programme, and the 20-tesla demonstration in September 2021 validated the core technical premise, after which the company raised a $1.8 billion Series B to build its SPARC prototype. Series B then funds construction of a prototype system. As each milestone is reached, the nature of the risk shifts – from scientific risk at Seed, to engineering risk from Series A onward as hardware gets designed, built and tested. For the leading developers, engineering and integration risk is increasingly replacing fundamental scientific risk: prototype construction remains an engineering problem, while deployment risk becomes increasingly important as companies move towards first commercial plants, which no company has yet reached. Each shift is a de-risking event, and the changing investor mix is consistent with a broader pool of capital becoming available as companies mature and technical risk is progressively reduced. Larger rounds, then, reflect not just the rising cost of building and deploying hardware, but the widening pool of investors participating as companies progress through successive stages of technical development.
However, it is worth noting that most newer entrants have not yet reached Series B or beyond. The companies represented at Series C in this dataset are consequently all pre-2020 entrants, whose earlier rounds were raised in a market with materially smaller cheque sizes. As the newer cohort progresses, the coming years will show whether these patterns of capital escalation and stage timing continue to hold, or whether the new generation of fusion startups charts a faster or leaner path.
This analysis is based on capital volume and does not incorporate company valuations or dilution data, which are not systematically available for private fusion companies. The data that has been collected suggest a near universal and steady uptick in valuations; nonetheless, conclusions about investor risk appetite should be treated as directional. Larger rounds at later stages indicate that investors are willing to commit greater capital as technical complexity increases, but without valuation data it is not possible to determine whether this reflects growing confidence in fusion’s prospects or whether investors are demanding larger ownership stakes to compensate for rising risk. This remains a material gap in the available data.
Investor Landscape
Investor Type Evolution
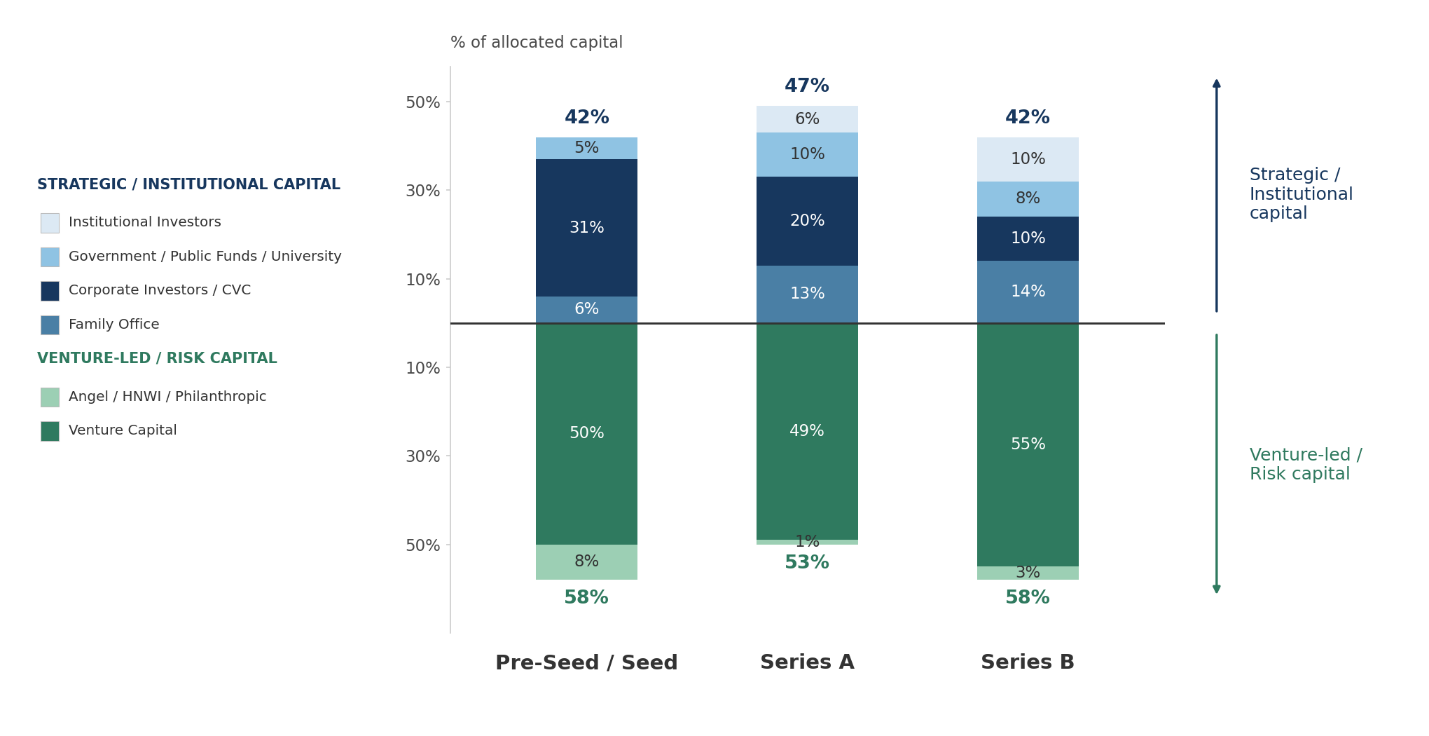
The chart above shows who finances fusion companies at each stage, based on Dataset 2, split between venture-led risk capital and strategic and institutional capital. Stage-level figures reflect the companies in the sample with allocation data at each stage; the percentages represent the average investor-type share across those companies rather than each investor type’s share of aggregate sector capital. Only a small number of companies have reached Series B, so figures at that stage are indicative rather than representative.
Three observations stand out.
- Strategic and institutional capital holds above 40% of allocated financing at every stage in the sample. This runs against the standard venture path, where strategic capital typically arrives later. The Series A profile is partly shaped by recent European rounds, where state-backed innovation funds have taken large positions. As more non-US companies progress beyond Series A, the government share at later stages could rise further, and the venture-led look of the Series B mix may fade.
- Corporate investors are unusually active at the earliest stage – 31% at Pre-Seed/Seed. Their presence alongside venture investors shows that strategic capital is willing to take exposure before the principal scientific and engineering risks have been retired, rather than waiting for later-stage commercial validation.
- Family offices and institutional investors build their presence as companies progress – family offices from 6% to 14%, institutional investors from near zero to 10% by Series B. Their growing participation broadens the capital base beyond venture and corporate investors, potentially increasing the range of capital available as financing requirements grow, though the Series B end-point again reflects a handful of companies.
The averages above mask how different individual companies look. Investor composition varies widely from one company to another. For example, at Pre-Seed/Seed, the same category can dominate one company’s financing and be entirely absent from another’s; some companies are almost fully backed by a corporate partner, others are funded by venture syndicates alone, others by angels or family offices. This variation is largest at the earliest stages and reflects how early fusion financing actually works: rounds are assembled through personal networks, prior relationships, and individual investor conviction rather than through any established model of how a fusion company “should” be funded. The chart below shows the composition of 10 fusion companies Pre-Seed/Seed capital stacks.
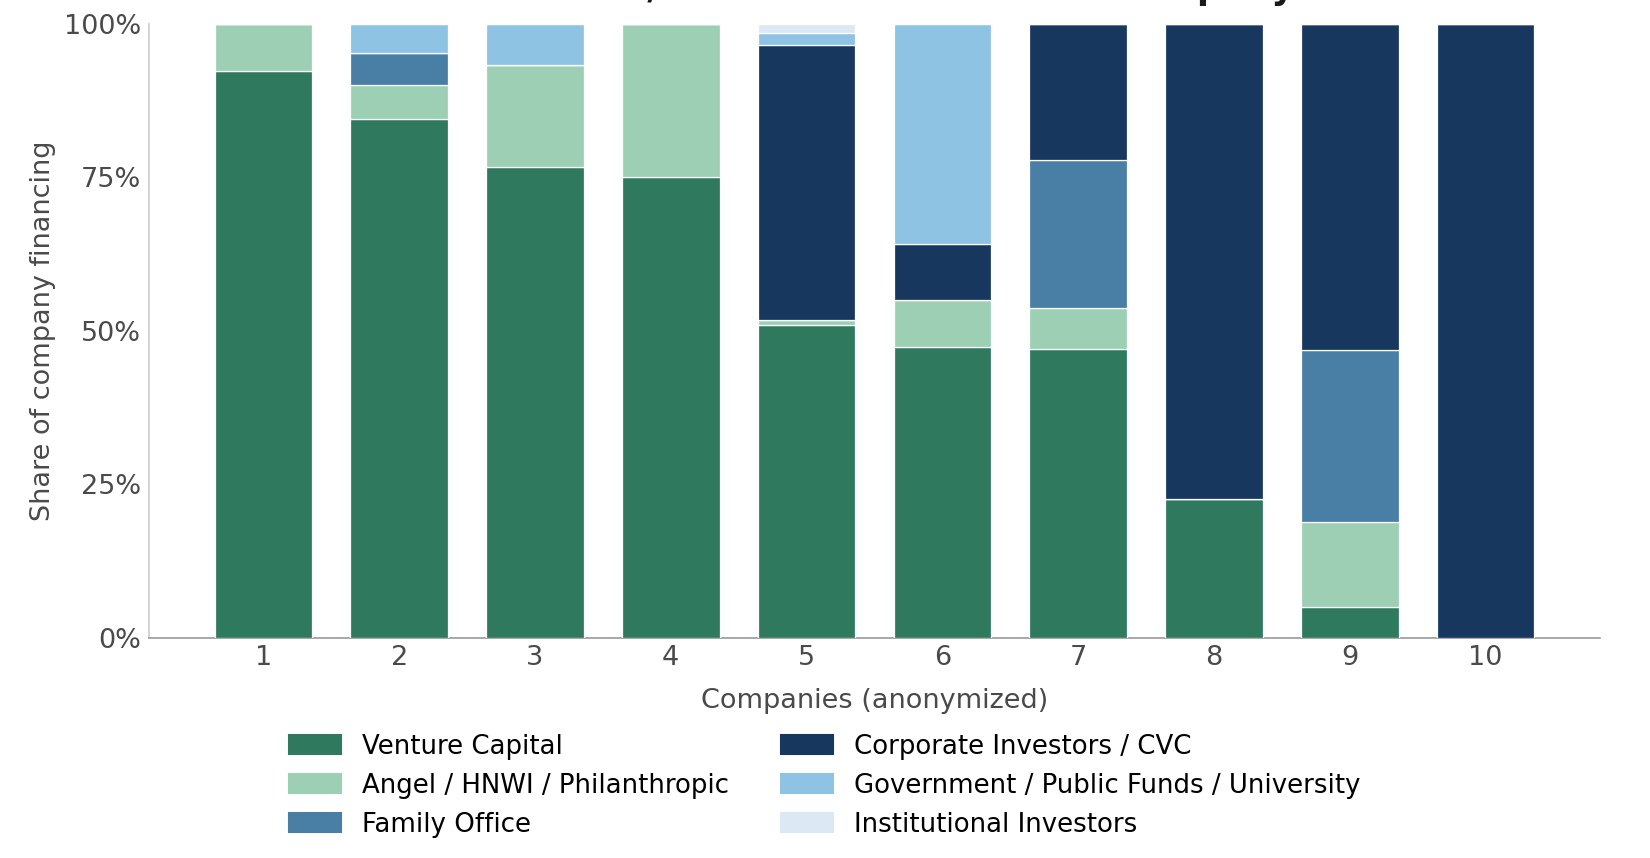
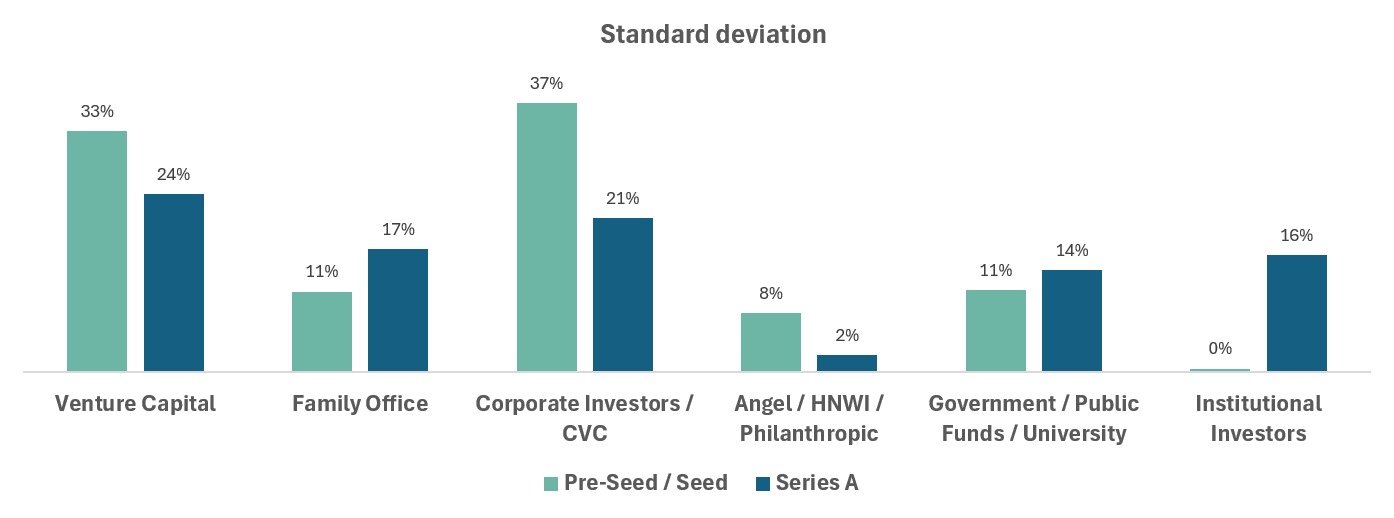
Comparing the standard deviation of investor-type shares between the two stages puts this variation into numbers and provides some evidence of convergence. At Pre-Seed/Seed, the spread across companies is widest for corporate investors (37%) and venture capital (33%); at Series A, dispersion for both declines to 21% and 24% respectively, which may point to a gradual convergence toward more standardised financing compositions as companies progress. The pattern is not consistent across all investor types, however: family offices and institutional investors show their widest spread precisely at Series A – some rounds carry a large family office or endowment position, most carry none – and the sample is too small to separate an emerging pattern from the particular histories of a handful of companies. Whether investor composition is genuinely standardising will only become clear as more of the cohort progresses to later stages.
Geographic Footprint
Fusion investment continues to globalise, but strong regional ties between companies and their investors remain clear. North America remains dominant, while European and U.K. companies rely more heavily on regional capital and public co-investment mechanisms.
For U.S. companies, capital remains heavily domestic, though with broader geographic representation. Approximately 71% of private capital originates from North American investors, with 10% coming from Europe and the U.K. and 18% from other regions. Notably, nearly half of this 18% is sourced from Japan, reflecting strong Japanese interest in fusion commercialisation. The remainder comes from Australia, the Middle East, and other regions.
European and U.K. fusion companies show a different profile, with more limited international participation. Their capital base is predominantly regional, with 89% of invested capital coming from Europe (71% from the EU-27 and 18% from non-EU European countries). U.S. investors account for approximately 11% of total capital, while only around 1% comes from other regions. This indicates that European fusion ventures rely primarily on local funding, particularly from venture funds and public co-investment mechanisms. While they do attract some transatlantic capital, it remains significantly lower than that of their U.S. peers.
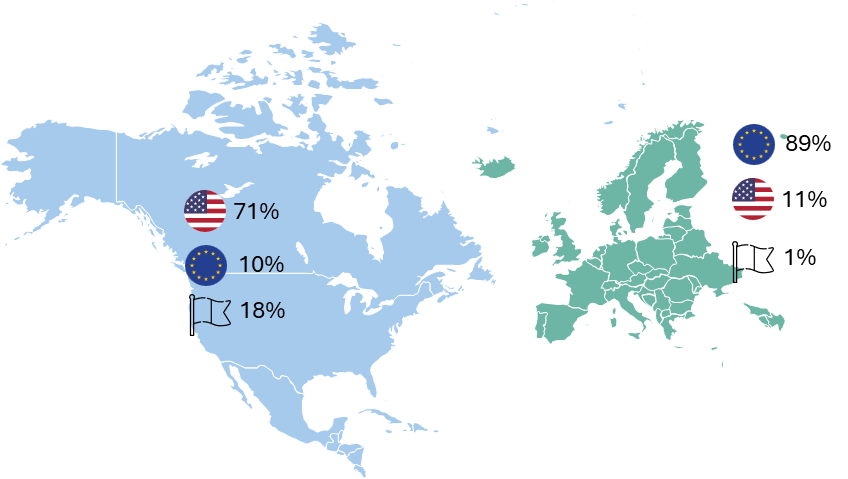
Overall, a key pattern emerges: fusion investment is still locally anchored, but globally enriched. Startups often receive the majority of their capital from home-region investors, supported by local government incentives and policy frameworks, but bring in complementary global capital as they scale. North America and Japan appear to be the most active cross-border investors, while European startups remain more internally financed.
As competition to host fusion demonstration plants heats up, these geographic capital flows will likely shape where technologies get built. Government support remains a strong magnet, but so too does the global search for commercially viable fusion – and the capital increasingly follows.
Public vs Private Funding
Private investors continue to drive the bulk of fusion funding. Public capital plays a catalytic role in supporting early prototypes and validation milestones that fall outside the risk tolerance of venture investors, and is playing an increasingly strategic role in several markets. Governments are deploying a range of instruments to de-risk commercialisation, support progression through milestones, and co-fund facilities. Beyond direct funding, government participation can also provide a signalling effect and support the mobilisation of private capital. However, while this public engagement is meaningful, it remains unclear whether it is sufficient in scale or structure to bridge the gap toward bankable, debt-financeable projects.
Based on the full FusionX database, North America remains overwhelmingly private-led, with approximately 95% of capital coming from private sources and 5% from public or non-dilutive funding. In contrast, Europe shows a meaningfully higher level of public participation. Across the EU-27, public capital accounts for approximately 20% of total funding, while in the U.K. it represents 14%, resulting in a combined Europe + U.K. profile of roughly 18% public and non-dilutive capital. This reflects stronger government co-investment frameworks and a more active role of public institutions in supporting fusion development.
These figures point to different patterns of early-stage risk capital. Public funding plays a materially larger role in the U.K. and continental Europe, while the U.S. model has been overwhelmingly private-led, with venture capital carrying much more of the early financing burden. But the harder capital problem is still ahead: deployment at scale, learning curves, and manufacturing buildout require patient, large capital over long timelines, structurally different from what venture capital provides. This suggests that the next role for government may be different from the one it has played to date: not primarily providing early risk capital, but helping transfer or bound the risks that currently prevent infrastructure investors and lenders from participating.
While risk capital has led the sector’s early growth, fusion is evolving from a private-sector innovation effort into a coordinated public-private endeavour, and the next phase will likely depend on how effectively public and private capital are aligned – through structured public-private partnerships, milestone-based funding, and regulatory mechanisms. Public financing strategies differ materially across markets; whether current public engagement is sufficient to bridge toward bankable assets or merely extends the equity-led runway warrants dedicated analysis beyond this paper’s scope.
A further layer of the capital stack began forming in 2026, when the sector saw its first moves into public markets: two established developers announced Nasdaq listings through reverse mergers. Public markets widen the pool of equity available to the sector and give early investors a path to liquidity. The risk profile, however, does not change: the capital is still equity, and it still carries the full technology and engineering risk. The listings also do not resolve the debt question: that will require projects with predictable revenues.
Conclusion
Between 2020 and 2026, private sector fusion moved from a niche bet to a sector with $21.3 billion of committed capital. Beyond the headline growth, the data points to several features of how the sector is actually financed:
Fusion has never been a venture capital dominated story. Strategic and institutional capital has been present from the first check: corporates taking exposure to science-stage risk at Seed, family offices and institutional investors building positions as companies progress, and public capital playing a materially larger role in Europe while the U.S. has remained overwhelmingly private-led. Financing structures that began as one-off, relationship-driven arrangements show some signs of convergence as companies progress.
Capital requirements increase as companies progress through de-risking milestones. Round sizes step up as companies move from paper-stage concepts into hardware, prototypes and increasingly integrated systems. The changing investor mix is consistent with a broader pool of capital becoming available as technical development progresses.
There is still no standard way to finance a fusion company. Early-stage compositions differ radically from one company to the next, assembled through personal networks and individual investor conviction. Signs of standardisation appear from Series A onward, but the sample is too small to call it a trend.
Geography shapes the capital, and the state shapes its composition. Companies raise predominantly from home-region investors, with public capital playing a materially larger role in Europe and private capital dominating in the U.S. The harder task in both markets – enabling the transition to deployment-scale capital – still lies ahead.
Fusion is maturing from a scientific venture into an industrial one, and investors are behaving accordingly. Increasingly, capital is accompanied by relationships that can bring value beyond cash: supply chain development, industrial partnerships, and offtake agreements such as the Helion-Microsoft power purchase agreement and CFS’s arrangements with Google and Eni. Fundraising announcements now pair capital raises with customer partnerships and pilot plant plans; investors are funding not just research, but the path to market.
Taken together, fusion startups in 2026 have access to capital sources and partnership opportunities that did not exist five years prior, and this provides a stronger foundation for the technical and engineering challenges that remain. To date, equity investors have expanded their role as capital requirements have grown, effectively bridging the sector towards a future financing regime that is not yet defined. The question is how far that model can stretch. As companies approach first-of-a-kind plants, capital requirements rise while technology, construction and operating risks remain difficult to separate.
The critical transition is not simply raising ever-larger rounds, but the conversion of technical progress into assets with predictable revenues and sufficiently bounded risks – assets that can support infrastructure capital and project debt at scale. The capital that finances deployment at scale, infrastructure equity and project debt, has no meaningful entry point into fusion yet. Whether it arrives depends on whether fusion can give it an asset it can finance.
1. Committed capital, equity and non-dilutive, including China.
2. Those 15 companies are: Commonwealth Fusion Systems; First Light Fusion; Focused Energy; General Fusion; Helion Energy; Marvel Fusion; Pacific Fusion; Proxima Fusion; Renaissance Fusion; TAE Technologies; Tokamak Energy; Type One Energy; Xcimer Energy; Thea Energy; Zap Energy.
Analysis of FusionX data by Sergei Kniazev, Co-Founder, Module 12
Module 12 is a fusion-focused advisory firm specialising in the economics and commercialisation of fusion technologies. It provides techno-economic and financial modelling, investment analysis, market and regulatory strategy, and supply-chain advice to fusion companies, investors and industrial partners.